Digital Brochure Analytics: How to Track Engagement and Improve Performance
Published on: January 30, 2026
Digital brochures have evolved beyond simple information sharing. For many teams, they now play a central role in selling, educating, and aligning stakeholders. Yet despite this shift, brochures are still often treated like static files, with little insight into how they’re actually used.
Without digital brochure analytics, teams are forced to rely on assumptions. They can’t see who read the brochure, which sections captured attention, where interest dropped off, or whether the content influenced a decision. Without this visibility, it becomes harder to prioritize follow-ups, evaluate content performance, or clearly demonstrate impact to leadership.
Engagement analytics changes that dynamic. By showing how readers interact with digital brochures, how long they spend on each section, what they click, how far they scroll, and whether they return, brochures become measurable assets rather than black boxes. Teams gain a clearer understanding of what works, more confidence in what to improve, and concrete evidence to support decisions.
This guide explains how to use engagement data to improve digital brochures in practice. It covers the metrics that matter, how to interpret reader behavior, and how tools like Flipsnack make tracking and optimization easier to implement at scale. It’s especially useful for sales, marketing, training, and internal communication teams that rely on brochures to support real outcomes, not just share information.
What is a digital brochure?
A digital brochure, also known as an online brochure or e-brochure, is an interactive, browser-based publication used to present information about a product, service, organization, or event.
It combines the familiar structure of a traditional printed brochure with interactive, shareable, and trackable elements designed for digital use. Digital brochures can be presented in a scrollable or page-based format and are accessible across devices without downloads.
Unlike printed brochures or static PDFs, digital brochures are flexible and measurable.
Key metrics to track for digital brochure analytics
With digital brochures, you can track reader engagement and measure various metrics, analyze, and understand what content performs best and where readers lose interest. These insights help you optimize your brochure and improve marketing results.
Because digital brochures are easy to update and personalize, you can quickly adjust content and offers based on audience behavior, keeping your messaging relevant across campaigns and segments.
Not all metrics are equally valuable. The most useful brochure analytics help teams understand attention, interest, and action. With Flipsnack, teams can track all these digital brochure analytics in one place:
Engagement metrics: how people interact with content
These metrics indicate whether readers are genuinely engaged:
- Time spent per brochure or page
Reveals how much attention the content receives, beyond a simple open. - Click-through interactions
Shows which buttons, links, products, or sections attract interest. - Video and interactive element usage
Helps identify which formats resonate most with readers.
Behavior metrics: where engagement drops or peaks
Behavioral insights highlight opportunities to improve structure and flow:
- Entry and exit pages
Identify where readers begin and where they lose interest. - Scroll depth and page progression
Show how far readers go and whether they reach key sections. - Interaction patterns
Reveal how users navigate, not just what they click.
These insights are especially valuable when refining layout, navigation, or content hierarchy.
Conversion metrics: how engagement connects to outcomes
Engagement becomes most valuable when it connects to action.
- Form submissions and inquiries
- Downloads or shares
- Product interactions or shopping actions
Platforms like Flipsnack support thousands of teams across sales, marketing, retail, and enterprise communication, providing engagement analytics at both individual and portfolio levels.
Interactive brochure analytics vs. static PDF metrics
| Capability | Interactive Digital Brochures | Static PDFs |
| Views & readership | Track total views, unique readers, and repeat visits over time | Limited to downloads or email opens (if tracked at all) |
| Time spent | See how long readers spend on the brochure and on individual pages | No visibility into reading time or attention |
| Page-level performance | Identify high- and low-performing pages with drop-off insights | No page-level data |
| Clicks & interactions | Track clicks on links, buttons, products, videos, and forms | Clicks are not tracked or require complex workarounds |
| Heatmaps & attention data | Visualize where readers click and focus their attention | Not available |
| Audience behavior insights | Understand how different audiences engage (new vs returning, regions, devices) | No behavioral segmentation |
| Lead & conversion tracking | Measure form submissions, product interactions, and assisted conversions | Requires external tools and manual correlation |
| Content optimization | Update content instantly based on real engagement data | Changes require re-exporting and redistributing the file |
| ROI visibility | Clear link between engagement, action, and business outcomes | Impact is difficult to prove or justify |
| Decision-making | Data supports confident optimization and investment decisions | Decisions rely on assumptions and anecdotal feedback |
The right analytics approach depends on your team, your campaign, and your goals. In some cases, basic visibility may be enough. In others, understanding how content performs and how it influences decisions is critical.
How to track digital brochure performance (step-by-step) with Flipsnack
Tracking digital brochure performance doesn’t have to be complex or technical. With Flipsnack, teams can monitor engagement and understand how their brochures are used, without extra tools or setup. A typical workflow includes three simple steps:
1. Create or upload your brochure
Start by uploading an existing PDF or creating a digital brochure from scratch. Once published, performance tracking is automatically enabled, allowing you to gather insights from the moment your content is shared.
2. Add interactive elements
Interactivity helps turn views into measurable engagement. This can include:
- Buttons and links
- Videos and media
- Forms or questions
- Product hotspots or navigation elements
These features enhance the reader experience while generating meaningful engagement data.
3. Monitor performance over time
After sharing your brochure, you can track overall engagement trends, reader behavior across pages, and reader behavior across sections. And performance differences between audiences, campaigns, or use cases.
This makes it easier to understand what works, identify content that needs improvement, and manage multiple brochures more effectively, whether for marketing, sales, internal communication, or training.

Integrating brochure marketing analytics with your stack
Effective brochure analytics work best when combined with the tools teams already use. Built-in analytics in platforms like Flipsnack provide immediate insights into engagement, such as views, clicks, time spent, and heatmaps, without any technical setup, making it easy to understand how brochures perform.
For deeper analysis, brochure data can be connected to tools like Google Analytics or GA4 to track traffic sources, campaign performance, and cross-channel behavior.
When brochures include forms or calls to action, integrations with CRM and marketing platforms such as HubSpot or Salesforce help link engagement to leads, follow-ups, and pipeline activity.
Together, built-in analytics, visual insights, AI-generated performance signals, and external integrations turn brochures from standalone assets into measurable contributors across the customer journey, helping teams focus on the data that drives better decisions.
Not every team needs every metric. The goal isn’t to track everything; it’s to focus on the data that supports your objectives, whether that’s improving engagement, prioritizing follow-ups, or proving ROI internally.
How to interpret engagement data effectively
Engagement data only creates value when it’s easy to understand and act on. The goal is to identify what’s working, spot friction, and adjust content accordingly.
High-performing pages typically show longer reading time, repeated interactions, or return visits signals that content is relevant and worth expanding. On the other hand, pages with high exits or low engagement often point to unclear messaging, content overload, or poorly placed calls to action. These insights help teams refine structure and flow without rebuilding brochures from scratch.
Comparing engagement across audiences, such as prospects versus internal teams or new versus returning readers, also reveals opportunities for better targeting and personalization.
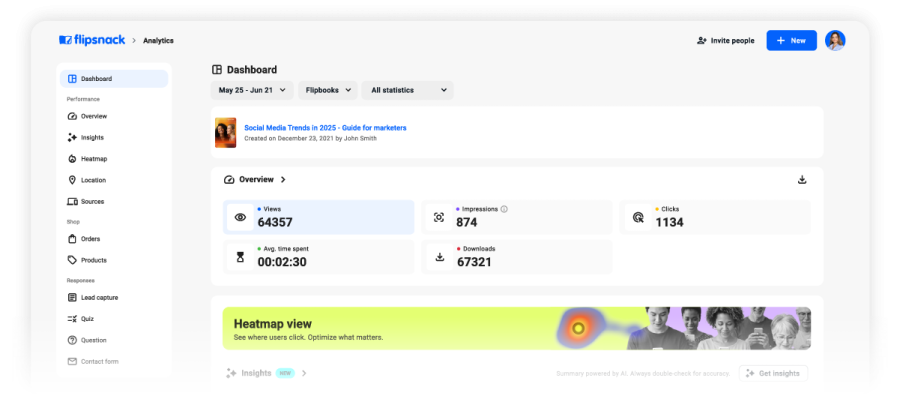
With Flipsnack Analytics, all of this data is available in one clear dashboard. Teams can review trends, compare performance across brochures or folders, and use visual heatmaps and AI-powered insights to quickly understand attention patterns and make confident, data-driven decisions.
Using engagement data to optimize digital brochures
Once teams understand the data, optimization becomes practical and continuous, supporting stronger engagement and better commercial outcomes.
Improve content through testing
Small changes, such as adjusting headlines, visuals, or CTA placement, can significantly improve engagement. Testing allows teams to validate improvements using real data, not assumptions.
Personalize based on engagement signals
Engagement data makes it easier to tailor content:
- Follow up with the sections readers showed interest in
- Adapt brochures for different industries or roles
- Refine messaging based on interaction patterns
Update content without changing the links
Digital brochures allow teams to update content while keeping the same sharing link. This makes it easy to improve low-performing sections without starting over or redistributing materials.
Over time, these improvements compound, leading to stronger engagement, longer reading times, and better outcomes.
From engagement to ROI: Turning data into business impact
Engagement analytics only matter when they lead to better decisions.
When teams align brochure data with business goals, they can clearly see what content works, focus on high-performing materials, and connect engagement directly to outcomes like leads, sales, and product adoption.
This connection becomes even more important when replacing print materials or static PDFs with digital brochures. Unlike traditional formats, digital engagement data provides clear proof of performance and measurable evidence to support the move to digital.
Case study: How Radioshuttle® turned engagement data from a brochure into sales results
Radioshuttle®, a global provider of automated warehouse systems, replaced long, static PowerPoint presentations with interactive digital brochures built in Flipsnack.
Their goals were clear:
- Increase engagement during sales meetings
- Support trade show conversations
- Give prospects an easier way to explore complex products
The results were immediate.
- Visitors spent over 11 minutes on average engaging with the brochure
- Engagement increased by 650% shortly after launch
Sales teams used the brochures on iPads at trade shows, shared them through a single link, and relied on analytics to see exactly how prospects interacted with product content.
As Gabrielle McCarthy, Digital Marketing Manager at Radioshuttle, explains, the brochure became “our most competitive sales tool.” It helped close major deals, improved distributor adoption, and gave both customers and sales teams a clearer understanding of their solutions.
By linking engagement data directly to sales activity, Radioshuttle transformed brochures from static collateral into a measurable driver of business growth.
Turning brochures into measurable assets with Flipsnack
Digital brochures shouldn’t be a black box. With the right engagement data and a tool that supports that, teams can track performance, measure impact, and continuously improve their content.
When businesses track reader engagement and teams measure content effectiveness using real-time reporting, brochures become more than documents; they become strategic tools that support sales, marketing, and internal communication goals.
With tools like Flipsnack, engagement tracking and optimization are easy to implement and scalable across teams. If you’re ready to stop guessing and start improving, digital brochure analytics give you the insight needed to make every brochure work harder.