How to Create a Digital Report. The Ultimate Guide for Professional Reports
If you’re wondering how to create a digital report that’s more than just a static PDF, you’re in the right place. A digital report today isn’t just about data. It’s about how you present that data. Visually, interactively, and with purpose.
Marketing managers need a better way to showcase campaign results. HR teams want reports that actually get read. Analysts are tired of clunky tools that limit how they present performance metrics. And executives? They just want clarity, fast.
Whether you work in the corporate, finance, or healthcare sector, your reports should do more than tick a box. They should drive action, align teams, and communicate value.
Flipsnack’s digital reports help you do exactly that. They streamline communication, make complex data easier to understand, and keep stakeholders engaged. All in one secure, shareable format.
Now let’s see how to create a digital report that’s interactive, professional, and data-driven.

Table of contents
- Understanding digital reports: Core components unlocked
- How to create a digital report that stands out with Flipsnack: Step-by-step guide
- Step 1: Define the report’s purpose and audience
- Step 2: Upload PDF, choose a template, or start from scratch
- Step 3: Structure your digital report’s content logically
- Step 4: Customize your digital report with interactivity and visuals
- Step 5: Create on-brand digital reports for a cohesive look
- Step 6: Review, collaborate, and edit
- Step 7: Publish, share and track your digital report
- Design & customization tips for professional reports
- Top benefits of digital reports: Why professionals are making the shift
- Best digital report software for professional business documents
- Create digital reports your team will actually read and act on – with Flipsnack
- Frequently asked questions about digital reports
Understanding digital reports: Core components unlocked
A digital report is an interactive, online document designed to present data, insights, and information in a visually engaging format. It can include videos, clickable links, charts, and graphics, making it easy to share, analyze, and access across devices. Marketing specialists and internal communication experts rely on digital reports to deliver professional documents in a dynamic format.
What sets digital reports apart? They’re interactive, branded, and trackable. Instead of sending out yet another bulky attachment, you can share a sleek, responsive report that quickly engages your audience.
Teams across industries use digital reports for a variety of purposes.
Here are a few common formats:
- KPI Reports – Share performance data with leadership, teams, or clients in a visual, easy-to-digest format.
- Global Annual Reports – Present company-wide insights across regions with dynamic content that feels unified and consistent.
- Foundation Reports – Showcase impact with storytelling elements that connect emotionally and build trust.
- Gated or Internal Reports – Share sensitive updates securely with selected audiences using access controls.
- Quarterly Business Reviews (QBRs) – Deliver key insights and strategic updates with more clarity and less back-and-forth.
Each of these reports can be created and published faster with Flipsnack. You don’t need advanced design skills. Just choose a template, add your content, and customize it to match your brand. I’ll later discuss this subject more in detail.
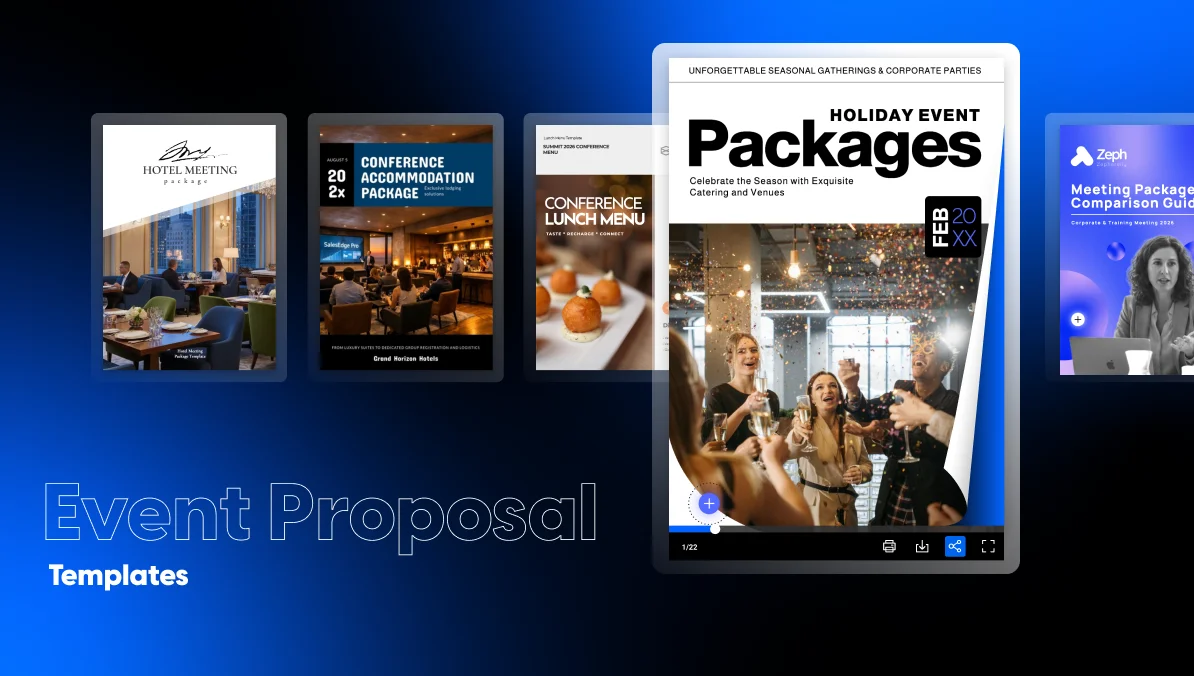
But for now, here’s an example of an interactive digital report from Flipsnack. Flip through it to get an idea of how your business’s digital report could look like.
A great digital report is built on four core elements:
- Visual data: Charts, graphs, and infographics help bring your numbers to life.
- Interactivity: Embed videos, links, and forms to make your reports more engaging and action-oriented.
- Branding & layout: Maintain visual consistency with your company’s brand book using custom fonts, logos, and colors.
- Navigation: Use clickable tables of contents, page-flipping animations, and internal links to guide the reader through the report smoothly.
With Flipsnack, these components are easy to implement. So your team can spend less time formatting and more time focusing on what really matters: communicating results clearly and professionally.
And now, let’s see exactly how to create a professional report in a matter of minutes.
How to create a digital report that stands out with Flipsnack: Step-by-step guide
Creating a digital report doesn’t have to be complicated. With the right structure and tools, you can build something that looks great, reads well, and serves a real purpose.
Let’s break it down into manageable steps.
Step 1: Define the report’s purpose and audience
Before you jump into templates or design, take a step back. Ask: Why are we creating this report? And who needs to read it?
There’s a big difference between a strategy-driven internal report for your leadership team and a performance summary meant for external stakeholders. And while there are many types of reports, it’s important to choose the one that aligns with your business goals.
Here are some common examples:
- Internal reports – Focus on operations, team performance, or internal KPIs. Keep the tone clear, professional, and data-rich.
- External reports – Like annual reports or foundation updates. These need stronger visual appeal, storytelling elements, and brand polish.
- Stakeholder-specific versions – You might need one version for executives, another for department heads, and a more summarized one for the board.
With Flipsnack, it’s easy to tailor different versions of the same report. Duplicate your layout, swap out content, and create personalized digital reports without starting from scratch.
Understanding your audience from the start ensures that your report not only looks good, but speaks directly to the people reading it.
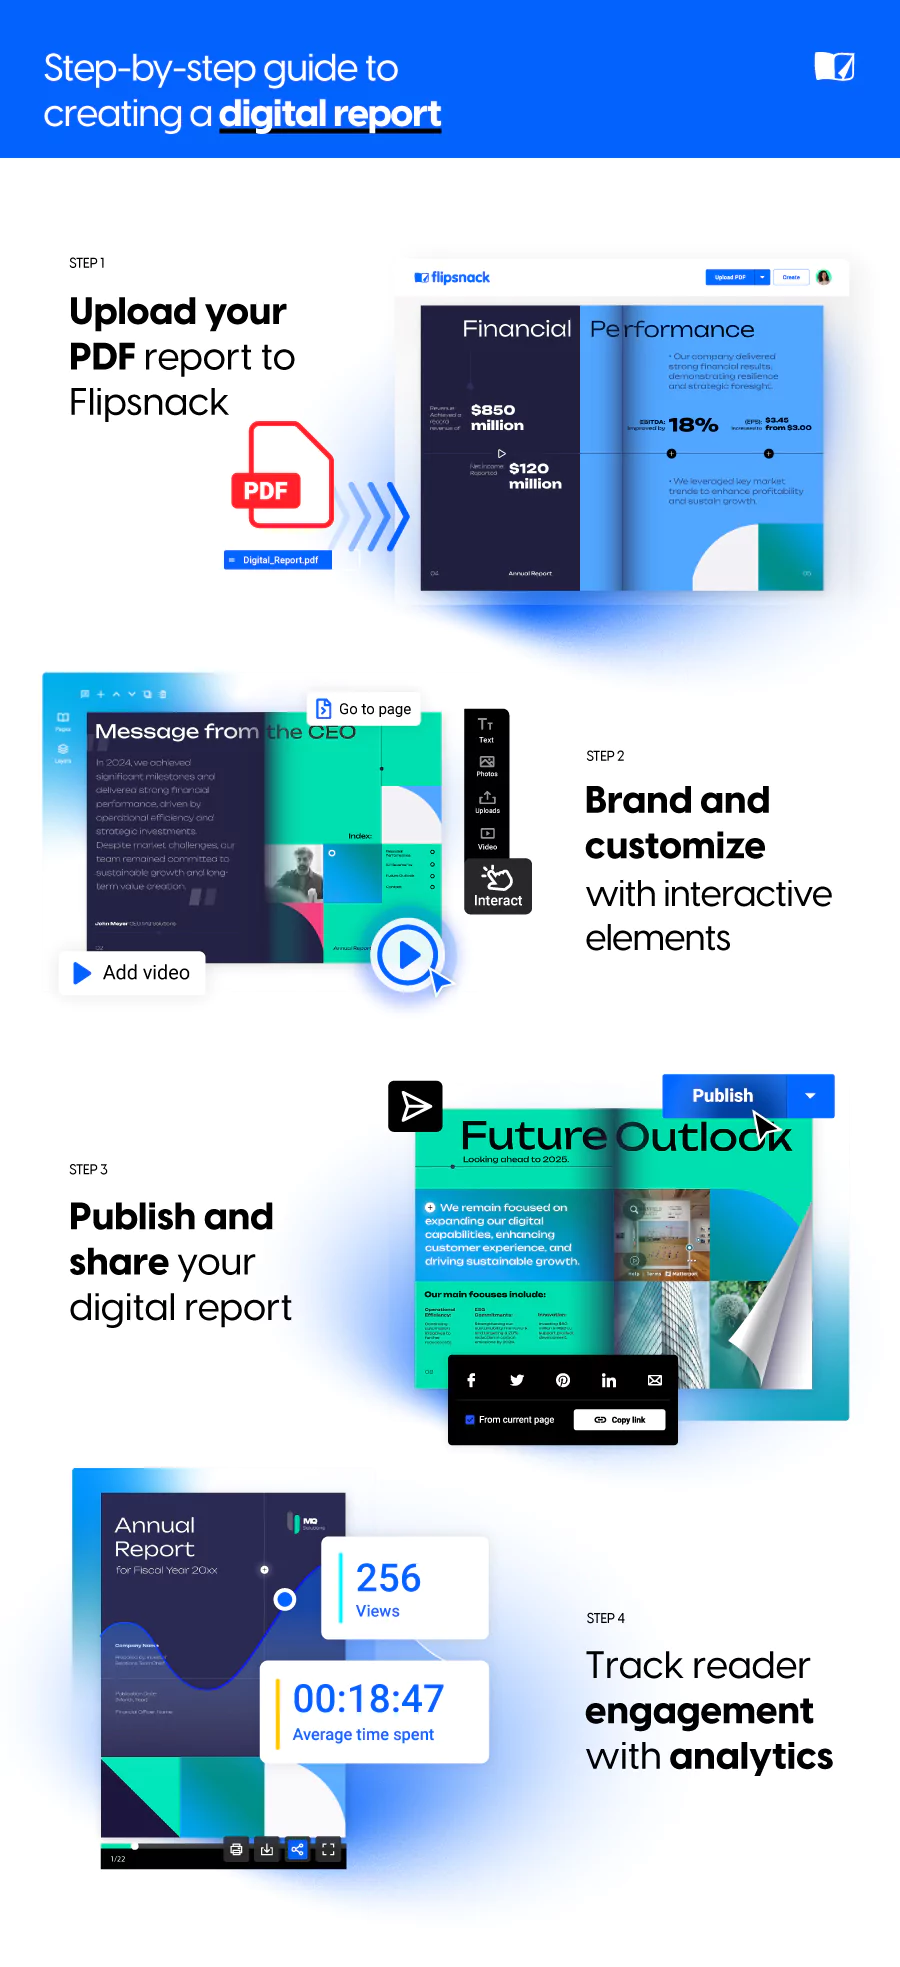
Step 2: Upload PDF, choose a template, or start from scratch
With the right tools, you can turn a status PDF into an interactive, branded report in just a few steps. This guide will walk you through the process using Flipsnack, a powerful flipbook platform that helps businesses and organizations design, customize, and share digital reports effortlessly.
Whether uploading a PDF, using a template, or starting from scratch, Flipsnack makes digital report creation fast and flexible. Templates offer a strong foundation by saving time on design while keeping your reports on-brand, easy to navigate, and tailored to your content.
Here’s where Flipsnack’s digital report templates come in. You’ll find pre-built layouts tailored for:
- KPI reports templates
- Internal annual report templates
- Global reports templates
- Foundation and impact report templates
- Quarterly report templates
Each template is designed with business reporting in mind. You can easily drag and drop content blocks, insert charts, and customize fonts and colors to match your brand guidelines.
Templates aren’t just a time-saver, they help ensure consistency across your organization. And when you’re sending reports to executives or external partners, that consistency speaks volumes. And if you need inspiration or ideas, explore some essential design tips and standout annual report examples.
Looking professional doesn’t have to take hours. With Flipsnack, it’s built right in.
Step 3: Structure your digital report’s content logically
Once your template is ready, it’s time to organize your content in a way that flows naturally and makes sense to your reader.
Start with a clear structure that mirrors how people absorb information:
- Executive summary – Give a quick overview of what the report covers and why it matters. Keep it high-level but informative.
- KPIs and performance metrics – Show the data that matters most. Use visuals like charts and graphs to make it easier to digest.
- Insights and analysis – Explain what the numbers mean. Add context, trends, or comparisons to help your audience understand the story behind the data.
- Visual highlights – Embed infographics, timelines, or even videos to break up text and keep engagement high.
Well-structured content builds trust. It shows your audience you value their time. Also, don’t forget to add a clickable table of contents (TOC). This simple feature helps readers jump to what they care about. And it’s especially useful for executives who want quick access to specific sections.
Flipsnack’s page-flipping format and interactive navigation tools make this easy. You can add internal links that guide the reader from start to finish.
The more intuitive your structure, the more likely your report gets read. And most importantly, understood.
Step 4: Customize your digital report with interactivity and visuals
A great digital report doesn’t just inform, it engages. And nothing pulls people in faster than strong visuals and a touch of interactivity.
One thing we know for sure is that interactive reports get read. That’s why Flipsnack gives you tools to embed charts for data visualization, videos that explain a section in more depth. Or clickable links to related documents or websites, and even include forms for feedback directly within the report. This interactive content invites your readers to engage, not just observe.
So, instead of filling your report with walls of text, try showing your data.
Turn key metrics into charts or infographics. Use comparison visuals to highlight progress or performance gaps. This makes information easier to scan and understand, especially for busy decision-makers.
This is especially useful if you’re presenting to stakeholders who expect a polished, modern experience. It also helps internal teams stay engaged and absorb information faster. Instead of sifting through text-heavy and static PDFs, they’re browsing something that feels intuitive and dynamic.
Flipsnack gives you the tools to make this seamless. You don’t need any coding or advanced design skills. With a simple drag and drop in our Design Studio, brands can customize digital reports in minutes. The result? A digital report that feels like a real experience, not just a file.
One of our clients, Keywords Studios, found it difficult to get their internal documents read across their global teams. Until they discovered Flipsnack.
As a leading international provider of technical and creative services to the video game industry, Keywords Studios needed a smarter way to engage employees with important content. Once they tapped into Flipsnack’s interactivity features, everything changed.
The result? Their internal publications are finally being read.

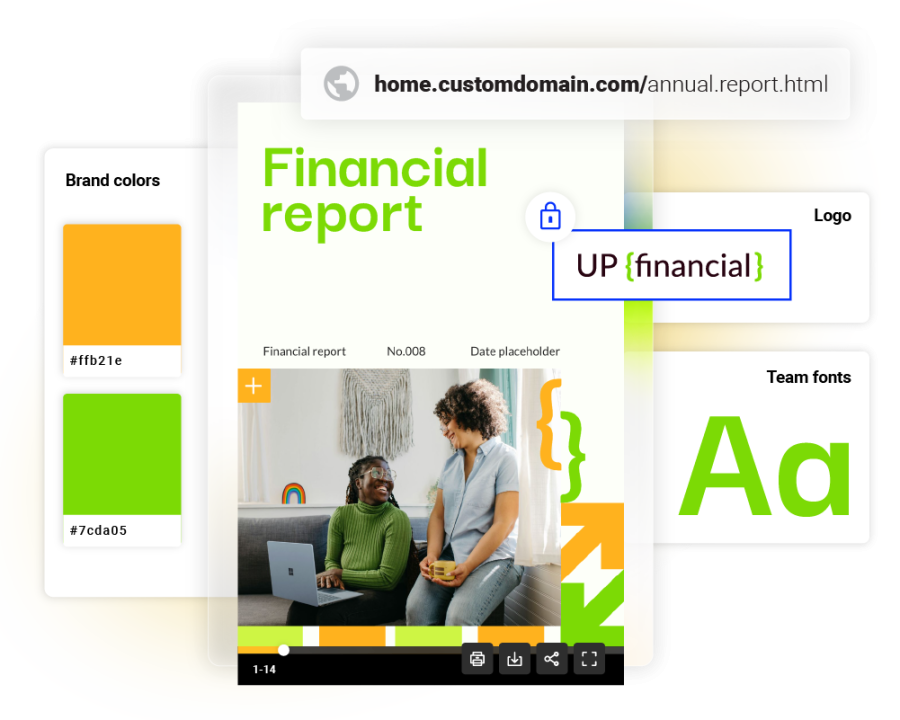
Step 5: Create on-brand digital reports for a cohesive look
Your report should feel like an extension of your brand. Not just in content, but in appearance too.
When someone opens your digital report, the design should immediately reflect your company’s identity. That means consistent fonts, colors, logos, and tone. It builds credibility, especially when sharing with external stakeholders or presenting to leadership.
Flipsnack makes brand customization simple. You can upload your brand kit once and apply it across all your digital reports. This ensures that no matter who’s creating the report, everything stays on-brand and visually cohesive.
Beyond branding, good design supports readability. Use white space to guide the eye, keep text blocks short, and highlight key takeaways with subtle accents. A cluttered layout leads to confusion, while a clean design leads to clarity.
If you want to tailor the experience further, adjust layouts depending on who’s reading. A data-heavy executive report may require sharper contrasts and larger charts, while an internal team report might benefit from softer visuals and more narrative flow.
With the right customization, your report isn’t just professional, it’s unmistakably yours.
Step 6: Review, collaborate, and edit
Before you hit publish, take the time to review your digital report. Even the most well-designed report can fall flat if the details are off.
Start by checking for clarity. Is the data accurate? Are the insights easy to follow? Are there any gaps or sections that feel too dense? A second set of eyes always helps. Especially if your report will be shared externally.
That’s where collaboration comes in. With Flipsnack’s built-in collaboration tools, your team can work together easily. Editors can leave comments, suggest changes, and update content without needing to juggle multiple versions or email threads.
This is particularly helpful when multiple departments are involved. Like when marketing owns the layout, but strategy or finance teams provide the numbers. Everyone stays aligned, and the feedback loop stays tight.
Once edits are in, give the report a final scan from the reader’s perspective. Does it flow? Does it answer the “why” behind the data?
Editing isn’t just about grammar or layout. It’s about making sure your message lands with impact. And with digital reports, every update you make is live instantly. No need to resend files or worry about version control.
A well-reviewed report shows that you value precision and professionalism, and your audience will notice.
Step 7: Publish, share and track your digital report
Once your digital report is polished and ready, it’s time to share it. But how you publish matters just as much as what you’ve created.
Need to keep the report internal? Send it privately or password-protect it. Sharing with select stakeholders? Gate it with access permissions. This level of control is essential when dealing with sensitive content like KPI dashboards, quarterly results, or performance reviews. You decide who sees what, and when.W
hat about tracking who’s reading and for how long? Flipsnack’s built-in analytics show you exactly that. Check views, clicks, time spent on each page, and form submissions. Use these statistics to understand what’s working, and where your message needs more attention.
And if something changes post-publish? Just update the report in Flipsnack. The link stays the same, but your audience always sees the latest version.
With traditional PDF reports, distribution is a bottleneck. With digital reports, it’s a strategic advantage.
Now let’s also cover some essential design tips that you have to know when creating a digital report.
Design & customization tips for professional reports
Good design does more than look nice, it helps people understand your content faster. A well-designed digital report feels effortless to read and navigate. That’s what keeps your audience engaged from start to finish.
So start with a clean layout. Avoid clutter. Use grid systems to align elements consistently across pages. This helps your report feel organized, and not overwhelming.
Typography plays a big role in readability. Choose a professional font that’s easy on the eyes. Use clear hierarchy: headlines should stand out, subheadings should guide, and body text should be balanced. If your reader has to work to follow your content, they’ll lose interest quickly.
Next, focus on color. Stick to your brand palette, but use contrast to highlight important data points. Don’t overdo it. Subtle accents are more effective than full-color overload. Consistency is key here, especially if you’re creating multiple reports over time.
Mobile-friendliness is no longer optional. Your report should look just as sharp on a phone or tablet as it does on a desktop. Flipsnack’s responsive design ensures your content adjusts automatically, so it’s accessible wherever your audience views it.
Finally, use icons, callouts, and visual cues to break down complex information. A well-placed graphic can simplify a dense stat or draw attention to a critical takeaway.
When your report looks polished and feels intuitive, it builds trust. And in a business setting, trust is everything.
If you’re still not convinced of the power interactive reports bring, let me continue.
Top benefits of digital reports: Why professionals are making the shift
Creating digital reports isn’t just a design decision. It’s a smarter, more efficient way to communicate results, share insights, and engage your audience. Professionals are shifting to digital formats because they offer a faster, more interactive way to present data, share insights, and keep audiences engaged.
And whether it’s for internal updates, client-facing reports, or executive summaries, digital reports make it easier to deliver information that’s not only seen. But understood and acted on.
Here are the benefits of using digital reports:
1. Enhanced data visualization and storytelling
Digital reports allow you to present complex data in a visual, intuitive way. Charts, graphs, and infographics help readers quickly understand performance and trends, turning raw data into clear insights.
2. Secure sharing with internal or external audiences
Whether you’re reporting to executives, clients, or team members, secure access matters. With digital reports, you can control who sees what by using gated access, password protection, or private links.
3. Real-time updates without resending files
Traditional formats mean new files every time there’s a change. With digital reports, you can make updates instantly without resending anything. One link stays live and always reflects the most current version.
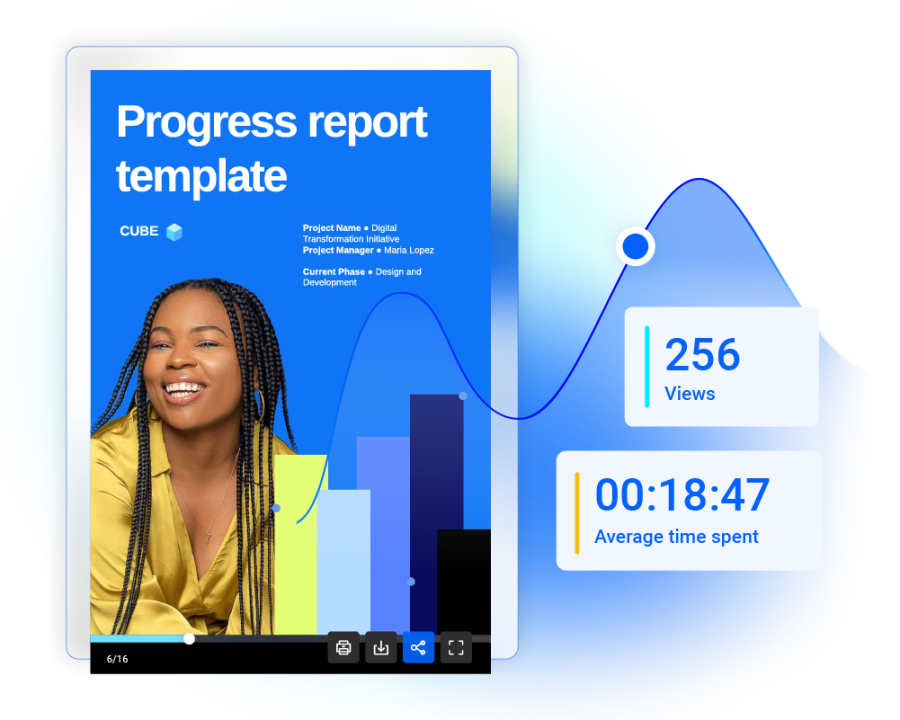
4. Performance insights via engagement analytics
Knowing whether your report was opened, and how far it was read, can shape future communication. Digital reporting tools like Flipsnack offer detailed statistics to track engagement and reader behavior.
5. Fully customizable templates
Save time and stay on brand. Use pre-designed templates that are easy to adjust, visually consistent, and built to support everything from KPI summaries to annual reports.
6. Collaboration features for teams
Reporting is rarely a solo effort. With real-time collaboration tools, your team can co-edit, leave comments, and finalize the report together. No more back-and-forth email chains or versioning issues.
7. Saves time and increases efficiency over manual formatting
Digital reports eliminate the tedious work of formatting slides or static documents. With tools built for reporting, you spend less time aligning elements and more time refining your message.
These advantages make digital reports a practical solution for any organization that values clarity, speed, and impact in its communications.
Best digital report software for professional business documents
When it comes to creating polished, engaging, and shareable digital reports, two popular tools stand out: Flipsnack and Adobe Indesign. Both offer online publishing solutions, but they serve different needs when it comes to interactivity, branding, and overall report performance.
Flipsnack – best for mid-sized businesses & large organizations
Flipsnack empowers businesses to transform static data into visually engaging, interactive reports. With its intuitive drag-and-drop editor, you can easily add videos, charts, links, and even embed forms directly into your report. This is perfect for turning passive readers into active participants.
Key features of using Flipsnack for digital reports:
- Fully customizable templates for faster report creation
- Advanced interactivity features like videos, GIFs, and forms
- Robust team collaboration tools for enterprise use
- Branding & white-label options to match your visual identity
- Secure sharing with trackable links and real-time analytics
- Seamless integrations with tools like Google Analytics, HubSpot, and more
Creating online reports with Flipsnack means better collaboration, better design, and better outcomes – without extra effort. If you don’t believe us, check the reviews and what our clients actually say about working with us.
Adobe Indesign – best for large organizations & professional designers
Key features of using Adobe Indesign for digital reports:
- Precision Layout Control – pixel-perfect design for complex reports
- Advanced Typography & Styles – ideal for branded, editorial-style reports
- Interactive Elements – add hyperlinks, buttons, and basic animations
- Master Pages & Templates – streamline multi-page designs
- Creative Cloud Integration – seamless access to Adobe Fonts, Stock, and assets
Create digital reports your team will actually read and act on – with Flipsnack
Switching from static PDFs to interactive digital reports isn’t just a modern upgrade. It’s a smarter way to communicate.
With digital reports, you’re not just sharing information. You’re delivering insights in a format that’s engaging, easy to navigate, and built for collaboration. Whether you’re reporting internally or externally, you save time, maintain consistency, and give your audience a better experience.
From templates to real-time updates and advanced analytics, Flipsnack gives you everything you need to streamline your reporting process, without sacrificing quality.
Now that you know how to create a digital report, try Flipsnack to bring your data to life with interactive, professional templates that reflect your brand and connect with your audience.
Frequently asked questions about digital reports
To make an online report, choose a digital reporting tool like Flipsnack, select a template, add your content, and publish it using a shareable link. No downloads or attachments required.
Yes. With Flipsnack, you can edit your digital report at any time. All updates are reflected instantly without changing the original link.
No. Flipsnack offers professional templates and drag-and-drop editing, so anyone can create a polished report without design experience.
Digital reports can be highly secure. Flipsnack offers features like password protection, gated access, and private links to control who can view your content.
Yes. Flipsnack allows multiple team members to collaborate, leave comments, and co-edit reports from a shared workspace.