Pitch Deck Financials Slide: What to Show at Every Stage
Published on: September 29, 2026
A pre-seed startup and a Series B company should not walk into an investor meeting with the same financials slide.
One is asking investors to believe a set of assumptions. The other has years of actual performance to defend. Yet pitch deck templates often treat financials as if the same revenue chart, margin line and three-year forecast work at every funding stage.
They don’t.
What belongs on a financials slide depends on how much your company has already proved. At pre-seed, burn, runway and the milestone your raise will fund may matter more than a revenue curve. By Series A and Series B, investors expect actual performance, unit economics and evidence that growth can repeat.
This guide explains which financial metrics belong in your interactive pitch deck at each funding stage, what should stay in the financial model or data room and how to make every projection defensible.

Table of contents
- What is a pitch deck financials slide?
- What financials should be in a pitch deck?
- Split your financials between the slide and the data room
- Match your financials slide to your funding stage
- See how a financials slide changes from pre-seed to Series B
- Do early-stage startups need a financial projections slide?
- Create and share your pitch deck financials slide in Flipsnack
- How to build a credible pitch deck financials slide
- Check your financials slide against the rest of your deck
- Avoid the seven mistakes that sink financial projections
- Turn your pitch deck financials slide into a clear investor story
- Frequently asked questions about the pitch deck financials slide
What is a pitch deck financials slide?
A pitch deck financials slide is the single page in an investor deck that summarizes a startup’s revenue projections, cost structure and cash position, usually covering three years and no more than five headline numbers.
In a typical pitch deck structure, the financials slide sits near the end of the deck, after traction and before the funding ask. Its job is not to prove the forecast is accurate, because no early-stage forecast is. Its job is to show that the founder understands which numbers drive the business and can defend the assumptions behind them.
What financials should be in a pitch deck?
Five elements, and nothing else: a revenue projection, a gross margin trajectory, operating expenses in three buckets, your burn rate alongside current runway, and one sentence naming the assumption that drives the whole forecast.
That last one is the element most founders omit and the one investors remember.
Which metrics fill those slots depends on your business model. Subscription businesses report ARR and MRR. Marketplaces need GMV alongside take rate and net revenue. Consumer apps live or die on retention and monetization rather than contract value. Pick the pair that describes how your company actually makes money.
- Revenue projection. Three years, annual figures, one line. Current year as actual or run-rate, not forecast.
- Gross margin trajectory. Direction influences how investors read everything else. Expanding from 68% to 74% tells a pricing-power story that a flat 74% does not.
- Operating expenses in three buckets. Sales and marketing, research and development, general and administrative. Percentages, not line items.
- Burn rate and runway. Monthly net burn and months remaining. One without the other is unreadable.
- The assumption anchor. What has to be true for this forecast to hold. “Assumes we hold 4% monthly logo churn while average contract value grows 18%.”
Split your financials between the slide and the data room
Most guidance stops at “put the detail in the data room” without saying where the line falls. Here is the line.
| Belongs on the slide | Belongs in the data room |
| Annual revenue, three years | Monthly revenue build, five years |
| Gross margin as a percentage | Full COGS breakdown by component |
| Opex in three buckets | Line-item budget and headcount plan |
| Monthly burn and months of runway | Cash flow statement and balance sheet |
| One assumption sentence | Assumption tab with every driver and its source |
| The funding ask as one number | Scenario models and sensitivity analysis |
The pattern is consistent: the slide carries conclusions, the model carries evidence. A partner scanning your investor pitch deck on a phone needs the conclusion. The associate running diligence three weeks later needs the evidence.
Build both. Send one.
Match your financials slide to your funding stage
A pre-seed slide showing five-year EBITDA and a Series B slide with no cohort data are opposite mistakes with the same cause, which is copying a template built for a different stage.
What changes between stages isn’t the metrics. It’s the ratio of history to forecast. A pre-seed slide relies almost entirely on assumptions. A Series B slide is mostly record, with a forecast attached to the end. So the slide moves through four states as the company proves more:
Assumptions, then evidence, then economics, then predictability.
| Stage | What investors need to believe | Financial evidence | Key metrics | Forecast horizon |
| Pre-seed | There could be a business here | Assumptions, burn, runway | Pilots, LOIs, early users, any revenue | 18 to 24 months |
| Seed | Customers actually want it | Early actuals plus a model | Revenue, growth, burn, runway | 2 to 3 years |
| Series A | It can scale | Actuals plus repeatable economics | Revenue, growth, acquisition cost, margin, retention | 3 years |
| Series B and later | Capital produces predictable returns | Operating history plus cohort economics | Retention, payback, margins, burn efficiency | Multi-year plan |
Treat these as expectations, not thresholds. No revenue figure makes a company Series A, and investors differ on where one stage ends. What holds is the direction: each round buys the evidence the next one asks for.
See how a financials slide changes from pre-seed to Series B
These examples follow one fictional company, Cadence, a B2B subscription platform for pharmacy inventory, from pre-seed to Series B. Every figure is invented to show the shape of each slide. Cadence sells subscriptions, so it reports ARR. A marketplace or consumer product would carry different metrics through the same progression. Each slide is built from a Flipsnack investor pitch deck template, linked underneath, so you can start from the layout and add your own figures.
Pre-seed: show the plan, not the projection
Cadence has a prototype and four pilot pharmacies paying nothing. A revenue forecast here is fiction, and investors know it. So the slide shows how the money gets spent and what it buys:
- Raising: $600,000
- Use of funds: 45% engineering, 25% product and design, 20% first sales hire, 10% operations
- Monthly burn: $33,000
- Runway: 18 months
- Milestone this round buys: 20 paying pharmacies at $8,000 MRR
No revenue curve. No gross margin.
Read those figures as one chain: the raise determines the runway, the runway has to reach the milestone and that milestone has to make the next round possible.


Best for: pre-revenue founders raising on a prototype and a plan.
Real-world application: replace the four spend categories with your own, and make the milestone specific enough that an investor could later check whether you hit it.
Common mistake to avoid: adding a revenue projection because the template has space for one. Empty space is a stronger signal than an invented curve.
Seed: tie your first revenue line to real customers
Cadence hit the milestone. Twenty-four pharmacies pay an average of $458 a month, or $132,000 in ARR. Now a projection holds up, because it starts from customers who exist:
- Current ARR: $132,000 across 24 customers
- Gross margin: 71%
- Projection: $132K in Year 1, $580K in Year 2, $1.4M in Year 3
- Raising: $2.5M, monthly burn rising to $95,000, 24 months of runway
- Assumption anchor: assumes 6 new pharmacies per month at current $458 average, holding 3% monthly churn
Roughly 4x then 2.4x is aggressive, and acceptable at seed because every number traces to a customer count and a price an investor can interrogate. Showing what the previous round achieved makes that forecast stronger: spent X, achieved Y, now expect Z.

Best for: seed founders with early paying customers and a repeatable price point.
Real-world application: swap the customer-count-times-price build for whatever drives your revenue, then make sure the assumption sentence names that driver.
Common mistake to avoid: smoothing the curve into a clean percentage. Investors want to see the mechanism, not the output.
Series A: prove the unit economics work
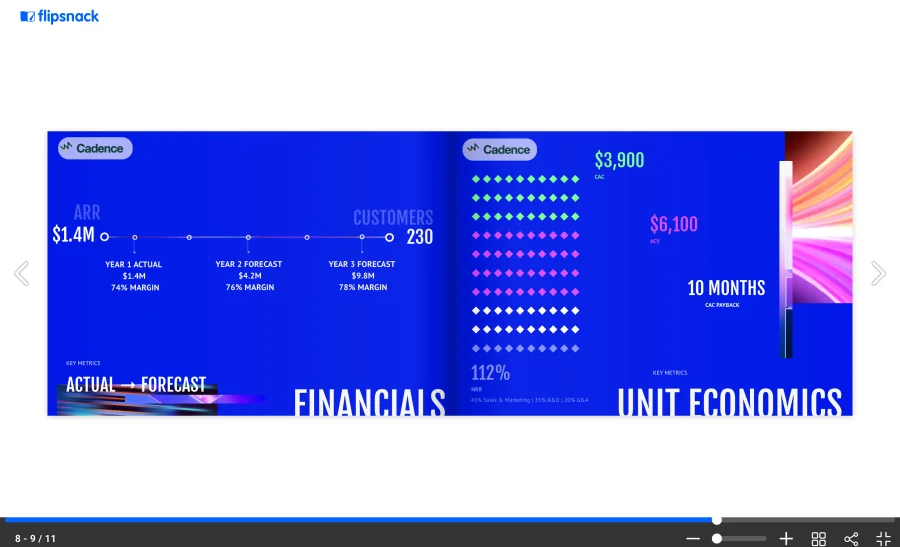
Cadence has 230 pharmacies and $1.4M ARR. The question shifts from whether anyone buys to whether buying scales profitably, so the slide grows to two pages and unit economics arrive:
- Current ARR: $1.4M, 230 customers, 74% gross margin
- CAC: $3,900. Annual contract value: $6,100. CAC payback: 10 months
- Net revenue retention: 112%
- Projection: $1.4M, then $4.2M, then $9.8M
- Opex split: 45% sales and marketing, 35% R&D, 20% G&A
- Raising: $9M, burn $310,000 monthly, 24 months of runway
CAC and contract value appear together, never apart. $3,900 means nothing alone. Beside a $6,100 contract at 74% margin it means acquisition cost comes back in ten months, and that is the number investors underwrite. NRR above 100% also shows that existing customers are generating more revenue over time.
Best for: Series A founders with enough customer history to calculate payback honestly. Real-world application: if your CAC payback runs past 18 months, show it anyway and explain the plan to shorten it. A hidden weak number found in diligence costs more than a disclosed one.
Common mistake to avoid: calculating LTV on optimistic churn. Understating monthly churn by one point can inflate lifetime value by half.
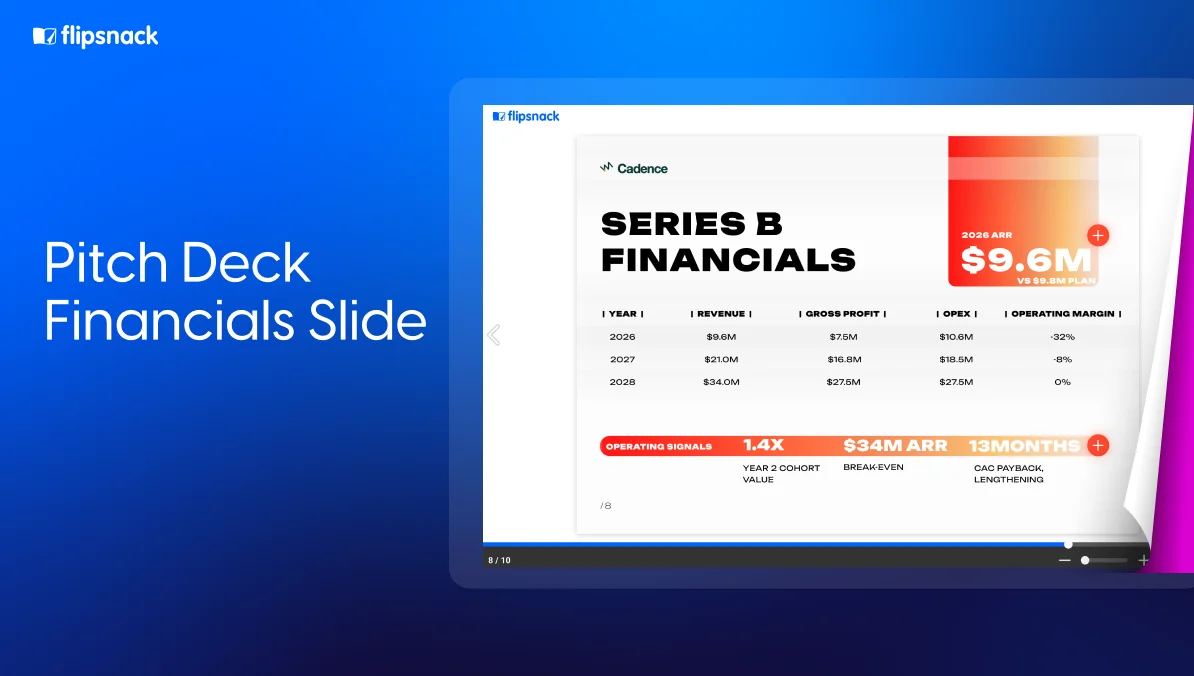
Series B and later: show the machine, not the story
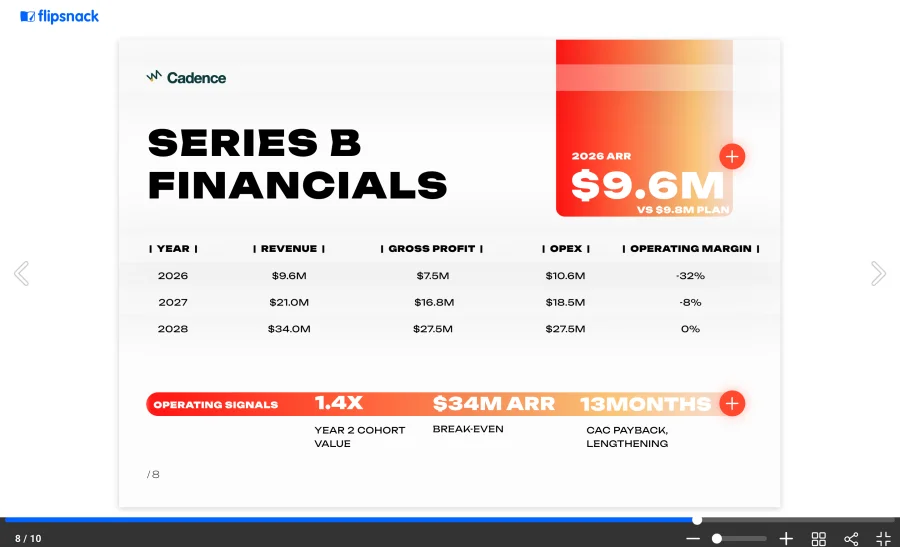
Cadence reached $9.6M ARR against the $9.8M it projected at Series A. Show the near-miss. Forecasting within 3% two years out proves something no narrative can.
The slide is now a compressed P&L:
- Current ARR: $9.6M, 78% gross margin, 118% net revenue retention
- Three-year P&L summary: revenue, gross profit, opex by bucket, operating margin
- CAC payback: 13 months, lengthening as the company moves upmarket
- Cohort performance: the Year 2 customer cohort now generates 1.4x its initial contract value
- Path to break-even: operating margin turns positive at approximately $34M ARR
- Raising: $28M
Series A sells potential. Series B sells proof.
The lengthening payback belongs on the slide precisely because it looks bad. An investor who finds it in diligence after you omitted it will wonder what else is missing.
Best for: growth-stage companies with enough history for cohort analysis.
Real-world application: pick the metric that has deteriorated and put it on the slide with your explanation attached.
Common mistake to avoid: a break-even date with no assumptions behind it. The date is only as credible as the margin path producing it.
Do early-stage startups need a financial projections slide?
Credible sources disagree, and the disagreement is worth understanding before you copy whichever answer you found first.
Waveup, a fundraising advisory that reviews several hundred decks a year, argues the slide should be skipped in most pre-seed and seed pitches, on the grounds that an unanchored forecast invites questions the founder cannot answer and costs more than the slide gains.
OpenVC, SlideModel and Startups.com treat it as standard, arguing that omitting it signals a founder who hasn’t thought about the economics at all.
Both are defensible because they solve different risks. The criterion that resolves it:
Include the slide if you can name the two or three drivers behind every number on it. If your revenue line traces to a customer count and a price you charge, show it. If it traces to market size times a hoped-for share, use the space for use of funds and milestones instead.
Empty space on a slide is recoverable. A forecast you can’t defend under three follow-up questions is not.
Create and share your pitch deck financials slide in Flipsnack
Step 1: Start from an investor pitch deck template. Pick the stage-appropriate layout from the examples above, or browse the full pitch deck template collection. Each one opens directly in Design Studio.
Step 2: Replace the placeholder figures with your own. Edit the revenue line, margin trajectory and opex split. Keep the assumption sentence, because it’s the element most templates leave out and most investors look for.
Step 3: Add your chart. Build it in Design Studio or bring one in, then check that both axes are labelled and the units are stated.
Step 4: Publish to a single link. Choose public, unlisted or password-protected depending on who’s receiving it.
Step 5: Update without resending. When your ARR moves between the first partner meeting and the partner call, edit the financials page and the same link shows the new figure. Nobody has a stale PDF sitting in an inbox, so your numbers stay current across every conversation.
Step 6: Check what investors actually read. Per-page statistics show which pages held attention and which were skipped, so you learn whether the financials slide landed before the follow-up call rather than after it.
Create your investor deck with Flipsnack and start for free, then update the financials as your numbers change.
How to build a credible pitch deck financials slide
A credible financials slide does three things well: it uses a realistic forecast horizon, separates scale from actual financial performance and ties every projection to assumptions you can defend.
Show three years on the slide, keep five in the model
Three years is the working default for seed and Series A. Build five for the data room, speak to three in the room.
| Horizon | Where it lives | What it’s for |
| 12 to 24 months | The slide, monthly in the model | The period you’re actually accountable for |
| 3 years | The slide | The growth trajectory investors evaluate |
| 4 to 5 years | The data room | Fund-return math and later-stage diligence |
Years four and five carry so much compounding uncertainty that a point estimate reads as false precision. If a fund requires them, present them as a range rather than a single figure, and say plainly that the range widens because the assumptions do.
Treat three years as a default, not a rule, because the horizon shifts with the stage. At pre-seed, 18 to 24 months to the next milestone matters more than year three, and a five-year curve on a pre-revenue slide reads as invention. At Series B, the path to break-even becomes central. Show enough years to make the trajectory legible and keep the rest where it can be examined.
Separate volume metrics from real financials
Transactions processed, properties listed, families served, units shipped. Impressive numbers, and none of them are financial performance. Companies with genuine scale reach for their largest figure, and the largest figure is almost never revenue.
| What founders show | What it measures | What investors underwrite |
| Transactions processed, units sold | Volume | Revenue you keep per transaction |
| Total value of goods or property moved | GMV | Net revenue and take rate |
| Users, downloads, families served | Reach | Paying customers and ARPU |
| Branches, partners, locations | Distribution | Revenue per account and retention |
GMV causes the most damage, because it looks closest to revenue. Worth keeping straight: GMV is a legitimate headline for a marketplace and investors expect it. What fails is GMV standing where revenue should be. Move $40M in goods at a 3% take rate and you have $1.2M in revenue, so showing the $40M alone reads as deliberate rather than careless.
The rule: every volume number needs its revenue number beside it. Without the pair, an impressive figure becomes evidence that revenue is what you didn’t want to show.
Anchor every projection to a defensible assumption
Investors don’t evaluate forecasts for accuracy. They evaluate them for reasoning, because a founder who reasons well about an uncertain future is the actual investment.
Build bottom-up, never top-down. Market size times assumed share is an aspiration with arithmetic attached. Jason Lemkin has written that projections which make no sense end conversations that merely ambitious ones survive.
Name two or three drivers, not ten. Every forecast rests on a few load-bearing assumptions. Identify yours and put one of them on the slide.
Cite one benchmark. “Assumes 74% gross margin, in line with vertical SaaS medians” is harder to dismiss than 74% standing alone.
Then prepare for the three questions that follow every financials slide:
- Where does the churn assumption come from?
- Which of these numbers are actuals and which are projections?
- What would have to go wrong for you to miss by half?
Answer the third one well and the first two matter less. Founders who can name their own downside have clearly looked at it.
Check your financials slide against the rest of your deck
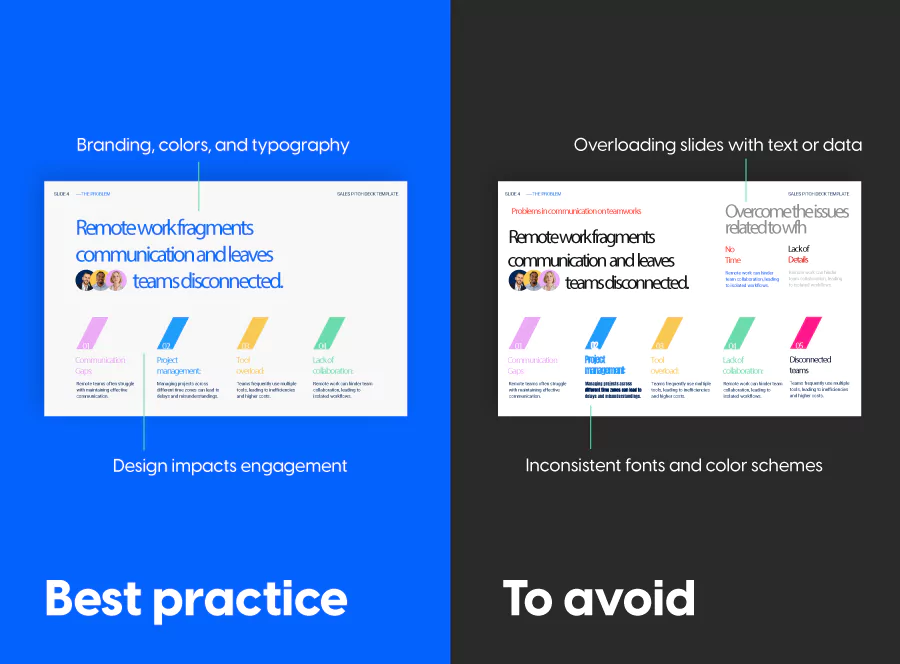
A financials slide is rarely rejected on its own. It gets rejected for contradicting something six pages earlier, and one contradiction makes every other number suspect.
Four cross-checks, all of which take minutes:
- Market against revenue. A $2B opportunity on one slide and $900,000 of year-three revenue on another describe different companies.
- Headcount against opex. Thirty planned hires need a payroll line for thirty salaries. Growth plans and cost projections drift apart constantly.
- Traction against year one. Your first projected year starts from the traction you already showed. A jump between them is the fastest credibility loss in the deck.
- The ask against the model. Raising $9M against a $4M shortfall suggests padding or a plan you haven’t described.
Read the deck backward once, financials first. Errors hidden in forward reading surface immediately in reverse. Publishing it as a flipbook helps, because paging through it the way an investor will makes a contradiction between page four and page eleven easier to catch.
Avoid the seven mistakes that sink financial projections
A quick pass before you send it:
- Hockey stick without economics. A chart drawn to a shape rather than built from a model.
- GMV presented as revenue. Still the single most common error.
- User growth without revenue growth. A cost projection wearing a growth costume.
- CAC with no contract value beside it. Neither number means anything alone.
- LTV built on understated churn. Inflates the number investors check first.
- A raise that doesn’t match the gap. Ask and model must describe the same company.
- False precision. $4,283,915 signals less confidence than $4.3M.
Other common pitch deck errors extend beyond the financials, but these are the ones that end meetings.
Turn your pitch deck financials slide into a clear investor story
The strongest financials slide doesn’t show the most numbers. It shows the numbers that match what your startup has already proved and what the next round needs to prove.
Keep the headline figures on the slide, the supporting detail in your model and the assumptions clear enough to defend in the room. With Flipsnack, you can build and share an interactive pitch deck, update the financials as your numbers change and keep the latest version available through the same link.
Investors don’t fund forecasts. They fund founders who can defend them.
Frequently asked questions about the pitch deck financials slide
No. Valuation is negotiated, not presented, and naming a number anchors a conversation you haven’t had. State what you’re raising and what it buys. An investor who wants to discuss valuation will raise it, and you’re stronger for having let them.
At Series A and later, yes. A base case with a named downside shows you’ve modelled risk. At pre-seed and seed, a single scenario is stronger, because three columns at that stage read as hedging rather than rigor.
The slide carries conclusions, the model carries evidence. A slide holds five numbers an investor absorbs in ten seconds. A model holds the monthly build, the assumption tab and the sensitivity analysis diligence works through weeks later. Build both, send the deck, keep the model ready.
AI can draft the structure and suggest which metrics suit your stage, but it cannot generate your numbers, and a forecast you didn’t build is one you cannot defend. Use it for framing, then do the arithmetic yourself. Flipsnack’s investor templates give you the structure so the remaining work is your own figures.